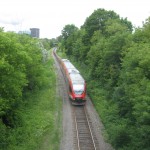
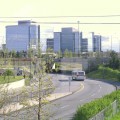
Traffic counts are conducted regularly at screenlines throughout the National Capital Region (NCR) and form a key part of the TRANS portfolio. Screenlines are imaginary lines typically drawn along features such as rivers or railways, which have a minimum number of crossing points, making it more manageable to count traffic going from one side to the other. Cordons are screenlines or groups of screenlines that enclose areas of interest.
The traffic counts recorded through each screenline are classification and occupancy (C&O) counts. Trained staff record the number of vehicles by class (e.g. automobiles, light commercial vehicles, heavy trucks, taxis, etc.) and the number of persons aboard each vehicle.
Data collected through this program provides transportation professionals with a tool to monitor travel patterns which can be assessed in the context of any given project affecting the transportation infrastructure of the NCR.
Certain traffic counts are available from TRANS upon request, in addition to other related resources. For definitions of some of the terminology used in traffic count reports, please consult the glossary.
Traffic Count Reports
Traffic count reports, or C&O reports, present the number of vehicles and persons counted, the resulting vehicle occupancy and modal shares. Modes assessed include auto vehicles, transit, bicycles, walking, and total vehicle/person travel.
When assessing data needs, its best to incorporate the area, the level of detail (cordon, screenline or individual counting station), the traffic direction (inbound vs. outbound) and the time period (e.g. 12 hours, 8 hours, AM or PM peak period, AM or PM peak hour) of interest. To request screenline counts, please contact the Web Administrator.
History of the Screenline Program
Trip data presented is based on weekday observations counted in May to end of June, and has been rounded to the nearest 10. Factoring of the data to normalize seasonal effects and/or weekday variations has not been undertaken. As the counts are attempted to be consistently counted every year at the same time, not factoring the data tends to have little effect on the trends. However, without applying the factors the mode volumes may be higher (walk and cycling) or lower (public transit) than the yearly averages.
Traffic counts are recorded yearly, collecting travel mode data at a screenline level with a classification and occupancy component. The program has been in existence since 1971, and storing the information in a database started in 1995. The program comprise 53 screenlines throughout the City of Ottawa. At its most aggregate level, the traffic count program captures travel entering/leaving the Greater Ottawa Area and the Central Business District (CBD), and moving north/south across the Ottawa River and east/west across the CP Rail Corridor and the Rideau River.
The City of Ottawa established its count program such that all sets and screenlines are surveyed in census years (every five years, 1981, 1986, 1991, 1996, 2001). Since 1991, yearly counts for non-census years have been structured to include a base count program and a number of secondary counts. In 2004 the methodology was modified and screenlines were selected so that some screenlines are counted every year, while others are only counted every other year.


